
Why is my Postgres query slow? Reading EXPLAIN ANALYZE, step by step
A query that felt instant in development starts taking a second in production. The fix is almost never guesswork. Postgres will tell you exactly what it did and how long each part took, if you know how to read the plan. This takes one real slow query, reads its EXPLAIN ANALYZE output line by line, finds the slow node, and fixes it.
The query
Top 20 customers by number of paid orders this quarter:
SELECT c.name, count(*) AS orders
FROM orders o
JOIN customers c ON c.id = o.customer_id
WHERE o.created_at >= '2026-07-01'
  AND o.status = 'paid'
GROUP BY c.name
ORDER BY orders DESC
LIMIT 20;
orders has two million rows. In development, with a few thousand, this was fine. Now it takes most of a second.
EXPLAIN, or EXPLAIN ANALYZE?
Plain EXPLAIN shows the planner's guess and never runs the query. You want the truth, so run it:
EXPLAIN (ANALYZE, BUFFERS) SELECT ...;
ANALYZE runs the query and reports the real time and real row counts. BUFFERS adds how much data came from cache versus disk. Both change how you read the output.
The plan
Limit  (actual time=812.4..812.4 rows=20 loops=1)
  ->  Sort  (actual time=812.4..812.4 rows=20 loops=1)
        Sort Key: (count(*)) DESC
        Sort Method: top-N heapsort  Memory: 26kB
        ->  HashAggregate  (actual time=805.1..808.9 rows=4120 loops=1)
              Group Key: c.name
              ->  Hash Join  (actual time=210.5..788.2 rows=48213 loops=1)
                    Hash Cond: (o.customer_id = c.id)
                    ->  Seq Scan on orders o
                          (cost=0.00..55000 rows=500 width=8)
                          (actual time=0.02..690.1 rows=48213 loops=1)
                          Filter: ((created_at >= '2026-07-01') AND (status = 'paid'))
                          Rows Removed by Filter: 1951787
                          Buffers: shared read=41667
                    ->  Hash  (actual time=210.0..210.0 rows=100000 loops=1)
                          ->  Seq Scan on customers c  (actual time=0.01..95.0 rows=100000 loops=1)
Planning Time: 0.3 ms
Execution Time: 813.0 ms
Read it from the inside out
A plan is a tree. The most indented nodes run first, and each one feeds its parent. So read bottom to top: the two Seq Scans run, the Hash Join combines them, HashAggregate groups, Sort orders, Limit cuts to 20.
Now the numbers on each node:
cost=start..totalis the planner's estimate in arbitrary units. It is not milliseconds and not comparable across machines. Ignore it once you haveANALYZE.actual time=start..totalis real, in milliseconds: time to the first row, then to the last. It is per loop, so multiply byloopsfor the real total.rows=Non thecostline is the estimate.rows=Non theactualline is what really came out. The gap between them is the single most useful signal in the whole plan.Buffers: shared read=Ncounts 8KB blocks fetched from disk.hitwould mean cache. Lots ofreadmeans you went to disk.
Find the slow node
Look for where the time jumps. The Seq Scan on orders runs from 0 to 690ms; everything above it adds only about 120ms more. That scan is the problem.
Two lines on that node say why:
rows=500 ... (actual ... rows=48213 ...)
Rows Removed by Filter: 1951787
The planner expected 500 matching rows and got 48,213, off by a factor of a hundred. And Rows Removed by Filter is the tell that seals it: Postgres read almost two million rows, checked the created_at and status filter on each one, and threw 1,951,787 of them away. It scanned the entire table to keep 2% of it, because there is no index on the columns in the WHERE.
Rows Removed by Filter is worth memorizing. A large number there means you are reading far more than you keep, and an index on the filtered columns will help.
The fix
Index the two columns in the filter. Order matters: put the equality column first, then the range column, so the index can seek to status = 'paid' and then walk the created_at range:
CREATE INDEX orders_status_created_idx ON orders (status, created_at);
Run the same EXPLAIN (ANALYZE, BUFFERS) again. The scan node changes:
->  Bitmap Heap Scan on orders o  (actual time=12.1..48.3 rows=48213 loops=1)
      Recheck Cond: ((status = 'paid') AND (created_at >= '2026-07-01'))
      Buffers: shared hit=9021 read=210
      ->  Bitmap Index Scan on orders_status_created_idx
            (actual time=9.8..9.8 rows=48213 loops=1)
Execution Time drops from 813ms to about 120ms. The Seq Scan and its two million discarded rows are gone, read fell from 41,667 blocks to a few hundred, and most of the work now comes from cache.
The smells worth knowing
Once you have read a few plans, the same problems keep showing up.
Estimated rows far from actual rows. The planner picks its whole strategy from the estimate. If the estimate is stale, it picks badly. When the two numbers are orders of magnitude apart, your statistics are out of date. Run ANALYZE orders; (or VACUUM ANALYZE orders;) and check again. Autovacuum usually keeps stats fresh, but it lags after a big bulk load.
A Nested Loop with high loops. A nested loop runs its inner side once per outer row. loops=100000 with an inner Seq Scan means you scanned a table a hundred thousand times. The fix is an index on the inner side's join column so each loop is an index lookup, not a scan.
A function wrapped around an indexed column. WHERE date(created_at) = '2026-07-01' cannot use an index on created_at, because the index stores the raw value, not date(...). Rewrite it as a range, created_at >= '2026-07-01' AND created_at < '2026-07-02', and the index works again.
A Sort that spills to disk. Sort Method: external merge Disk: 92160kB means the sort did not fit in work_mem and went to disk. Either raise work_mem for that query, or add an index that provides the order so the sort disappears.
Reading plans without squinting
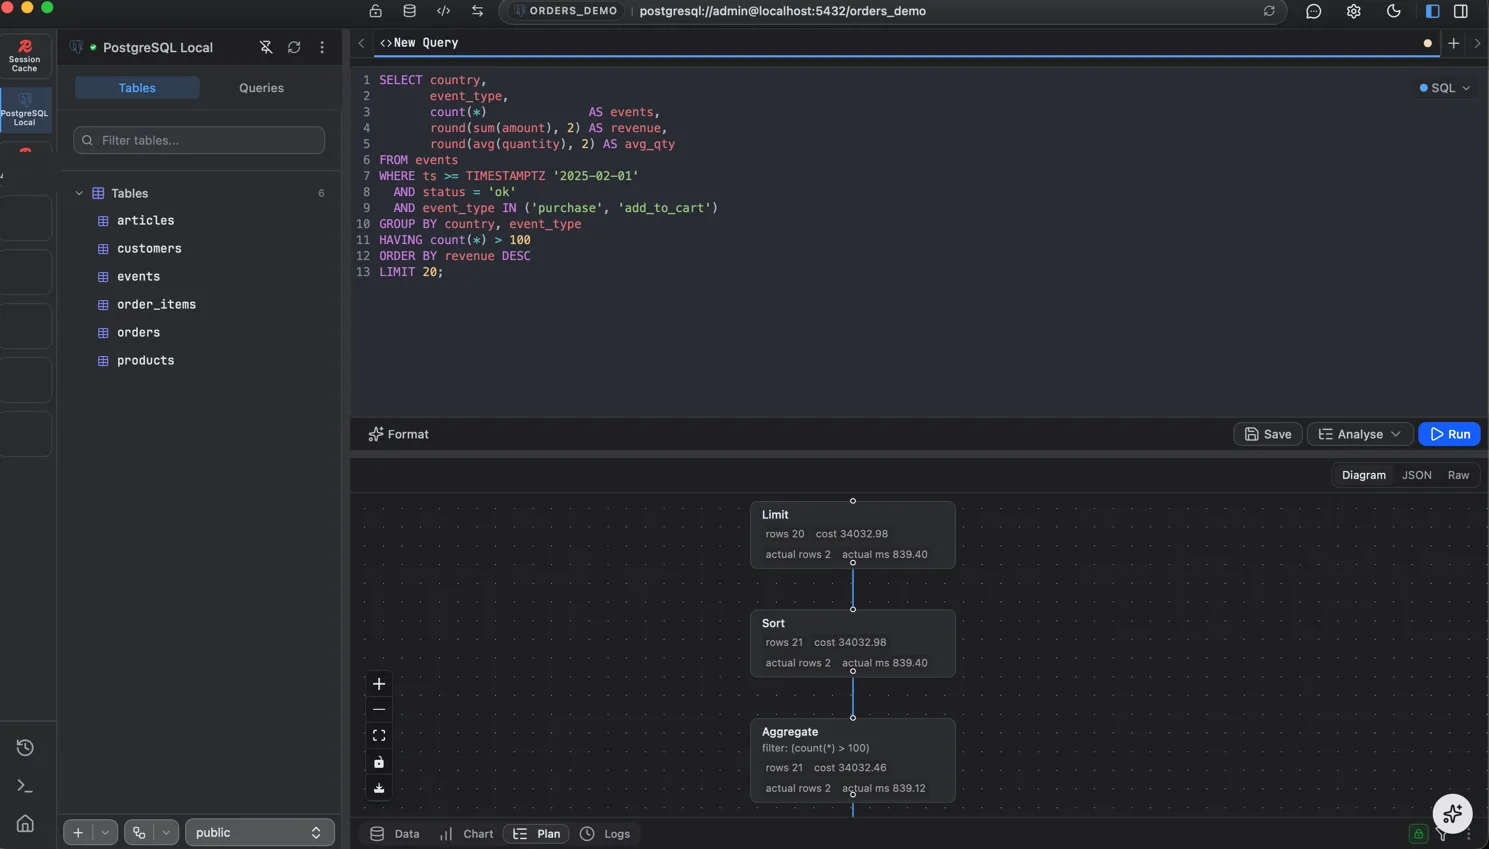
Text plans get hard to follow once they nest a few levels deep, because the indentation is all you have to track the tree. A visual plan lays the same tree out as boxes with the timings on each node, so the slow one is easy to spot. The screenshot above is this query's plan in FlexTable, which draws the tree and marks where the time went.
FAQ
What is the difference between EXPLAIN and EXPLAIN ANALYZE?
EXPLAIN shows the planner's estimated plan without running the query. EXPLAIN ANALYZE runs it and reports the real time and real row counts. Add BUFFERS to see cache versus disk.
What should I look at first?
The node where actual time jumps, and any node where the estimated rows are far from the actual rows. Those two point at the slow work and at stale statistics.
Why is Postgres not using my index?
Common reasons: a function around the column in the WHERE, statistics so stale the planner thinks a scan is cheaper, or the query returning most of the table, where a scan really is faster.
What does "Rows Removed by Filter" mean?
The number of rows a scan read and then discarded because they failed the WHERE. A large value means you are reading far more than you keep, and an index on the filtered columns will cut it down.
The visual plan above is from FlexTable, a free native client for Postgres and other SQL and NoSQL databases. Download it free.